SONAR Launches Centralized Dashboard for Trucking Safety Data
SONAR Launches Carrier Safety Dashboard On May 12, 2026, SONAR introduced its new Carrier Safety Dashboard in Chattanooga, Tennessee, aiming to create a unified platform for federal trucking data. This launch aligns with the CVSA International Roadcheck, a crucial 72-hour enforcement event for comme
SONAR Launches Carrier Safety Dashboard
On May 12, 2026, SONAR introduced its new Carrier Safety Dashboard in Chattanooga, Tennessee, aiming to create a unified platform for federal trucking data. This launch aligns with the CVSA International Roadcheck, a crucial 72-hour enforcement event for commercial vehicles across North America.
Data Aggregation for Enhanced Insights
The new dashboard consolidates information from the Federal Motor Carrier Safety Administration (FMCSA) and Compliance, Safety, Accountability (CSA) records, as noted by Detik Finance. It provides real-time data on crashes, roadside inspections, and out-of-service violations amid ongoing industry changes related to Commercial Driver’s Licenses (CDL).
Crash Data Overview
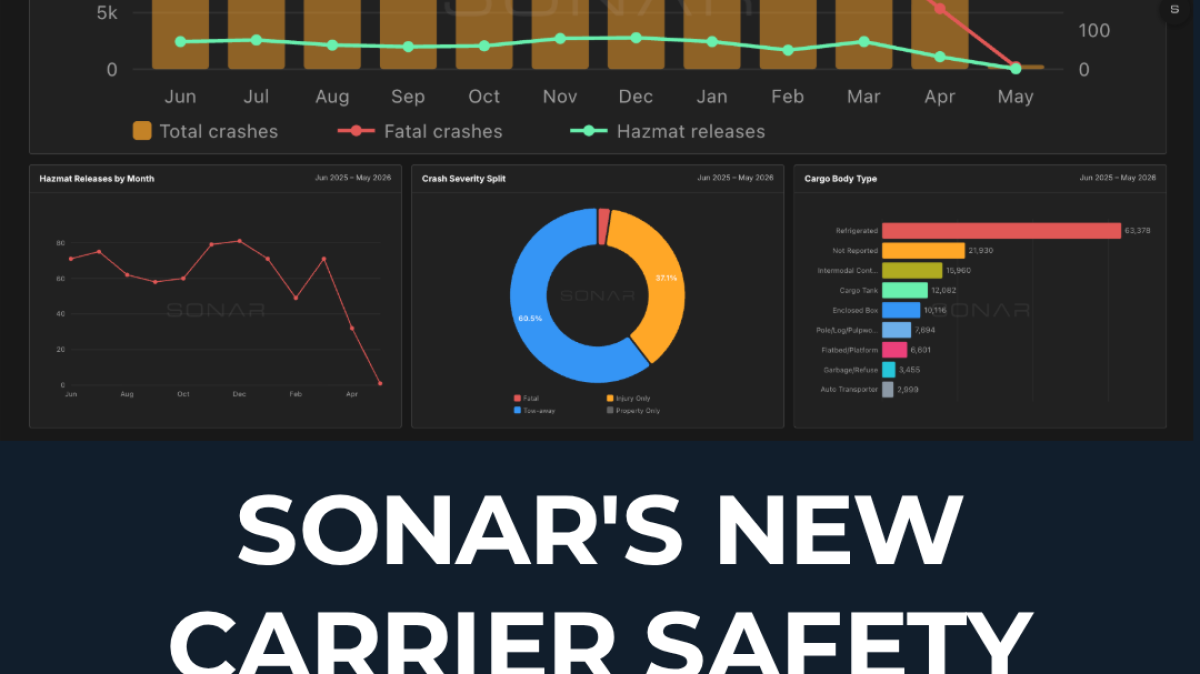
According to SONAR’s findings, the crash module recorded a total of 158,338 federal recordable crashes in the past year. Among these incidents, there were 3,916 fatal crashes and 60,386 injuries, with refrigerated trailers being the most affected category, accounting for 63,378 incidents.
Statistics Breakdown
Federal Recordable CMV Crash Data (Last 12 Months)
| Metric | Total Count | Percentage of Total | | --- | --- | --- | | Total Federal Recordable Crashes | 158,338 | 100% | | Fatal Crashes | 3,916 | 2.47% | | Injury-Only Crashes | 60,386 | 38.14% | | Hazmat-Involved Crashes | 740 | N/A | | Vehicles Towed | 146,967 | N/A |
Carrier Registration Statistics
The dashboard also tracks the carrier population, which has reached 172,689 registered carriers in the last year. This figure includes 99,358 interstate carriers and 67,325 intrastate non-hazardous material carriers, with California and Texas marking the highest levels of concentration on geographic heat maps.
Inspection Data Insights
Data on roadside inspections indicates that there were 2,908,513 inspections conducted over the previous 12 months. These inspections led to 579,831 out-of-service violations, with Level II walk-around inspections making up the majority at 36.0% of total activities.